Big data base for co-working and decision making

How is a company structured
Every company consists of departments that work together and collectively on the end goal and/or product of the company.
This also means that there are (necessary) various layers of decision-making management.
And an overarching management or board that keeps control over that.
Determine starting point
A budget is a financial business plan that is drawn up to plan and manage expected income and expenditure for a certain period, usually a year.
In the budget you indicate what you expect, a forecast as it were, but you also describe what resources you need to achieve the expected results and objectives.

Influences influence
Information about the market, competitors, and industry trends is important to understand the demand for products or services and to make realistic sales forecasts.
Factors such as interest rates, inflation, exchange rates, and economic growth can affect a company’s financial performance, so it is important to consider these external factors when developing a policy plan.

Performance engagement
The input from the organization in terms of ambitions and realistic expectations also form the basis for (performance) agreements between directors (and shareholders), the board of directors and management.
Determining frameworks
Most often, budgets are drawn up for (managers of) departments, so that they have a financial framework within which they can make independent decisions. For example, to invest in something or to spend on advertising and marketing.
By making various forecasts based on previous years and expectations, you also draw up the budgets for the departments, in addition to the performances to be achieved.
Always check up
In order to be able to adjust the plans as a director, you need good insight during the financial year into how and whether the objectives from the annual plan are being achieved.
That is why a control process is set up after or in addition to the planning.

Interim reports
The interim, often monthly report is intended for internal use to inform the board and management about how things are going in terms of turnover and expenditure, so that these current figures can be compared with the budget.
More about that later.
Free example reports and brochures
View and download a free sample liquidity budget here. With the Speedbooks sample liquidity budget you can see how easy it is to create a liquidity budget.
Download the Speedbooks® sample reports and brochures for free and experience the ease and benefits yourself.

Big data foundation for decision-making
In a data-driven world, it is crucial for a management team to always have access to the latest data on the company's financial performance.
Real-time financial monitoring makes it possible to quickly detect and eliminate inefficiencies and unnecessary costs, thereby maximizing profitability.
Continuous access to current financial performance is essential for effective, agile and future-proof management.
Threats and opportunities
By drawing up this report monthly, you can quickly anticipate changes, for example, take targeted steps in the event of disappointing results or in response to opportunities that suddenly arise.

Money in the till
Only then can you properly control that there is sufficient liquidity, i.e. money 'in the till' to meet all current obligations and that you make a profit in the long term.
Sufficient liquidity is essential for the financial stability, growth and resilience of a company.
Stability necessary
Liquidity ensures that a company can cover day-to-day operating costs, such as wages, rent, supplier payments, and utilities.
It enables the company to continue to operate steadily and smoothly, manage risks, and seize opportunities, contributing to its long-term success.

Saving time means profit
On average, a financial manager or CFO spends around 4-8 hours compiling self-compiled monthly financial reports for his MT.
With more in-depth analyses (forecasts, scenarios) this can easily increase to 12-20 hours.
Smart reporting software can radically reduce the time needed to create reports from many hours to a few minutes. The time saved can be used differently or better.
Management meeting document
The management report also serves as a primary meeting document for departmental meetings, MT meetings and board meetings.
It is therefore important that all relevant information is up to date and can be clearly explained and presented.
Because the participants are already aware of the current status of various business aspects and the most important discussion points, meetings can be held efficiently and decisions can be made.

Control over here and now
A management report can also serve as a basis for 'healthy' discussion during the meeting and for exchanging ideas and insights about trends, opportunities and threats.
In addition, you need a rhythm ('cadence') to spar with your colleagues from the MT about the financial figures.
An update is usually at least once a month, and on a quarterly and annual basis you really go into depth with a more extensive analysis.
What is in a management report
Limit the report to the essential, relevant information and the most important points, a clear structure and use graphs, diagrams and other visual elements. Graphs make trends, relationships and patterns quickly recognisable.
Finally, do not provide an extensive report but a concise explanation of the results and performance achieved, the causes, any external sources and the possible implications for the organisation.
Intelligent Decision making
Company and department leaders and managers can use periodic financial data to make (joint) decisions about cost savings, investments, personnel management and other strategic issues in the medium term.
Intelligent Forecasting based on scenarios can be prepared as input for management meetings, so-called "what if" scenarios. Which makes these meetings about the scenarios, not about presenting and understanding the reports.

Steering on key figures
Management reports almost always contain KPIs, the so-called:
Key Performance Indicators.
The most important Key Performance Indicators, which also show the most important measurable performance of the organization, include turnover, profitability and the efficiency of business processes.
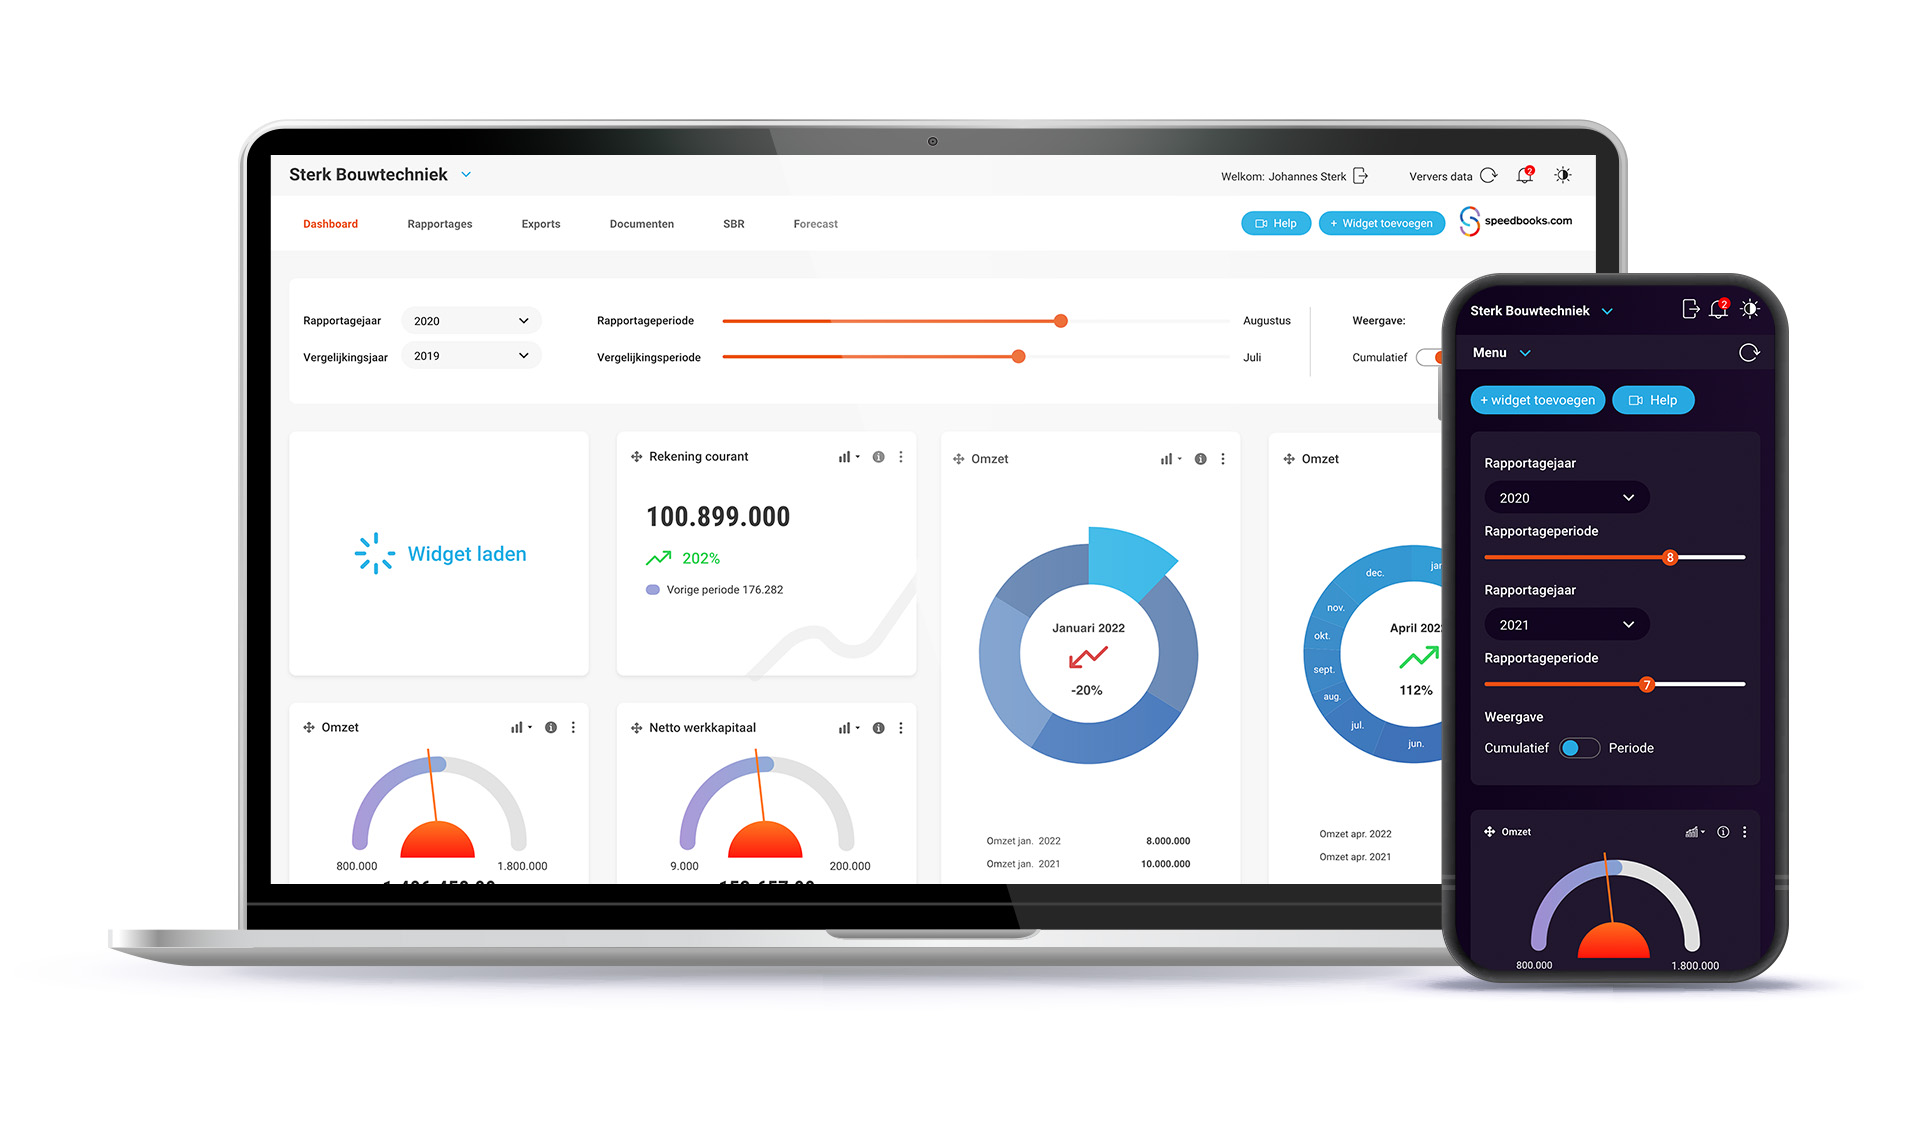
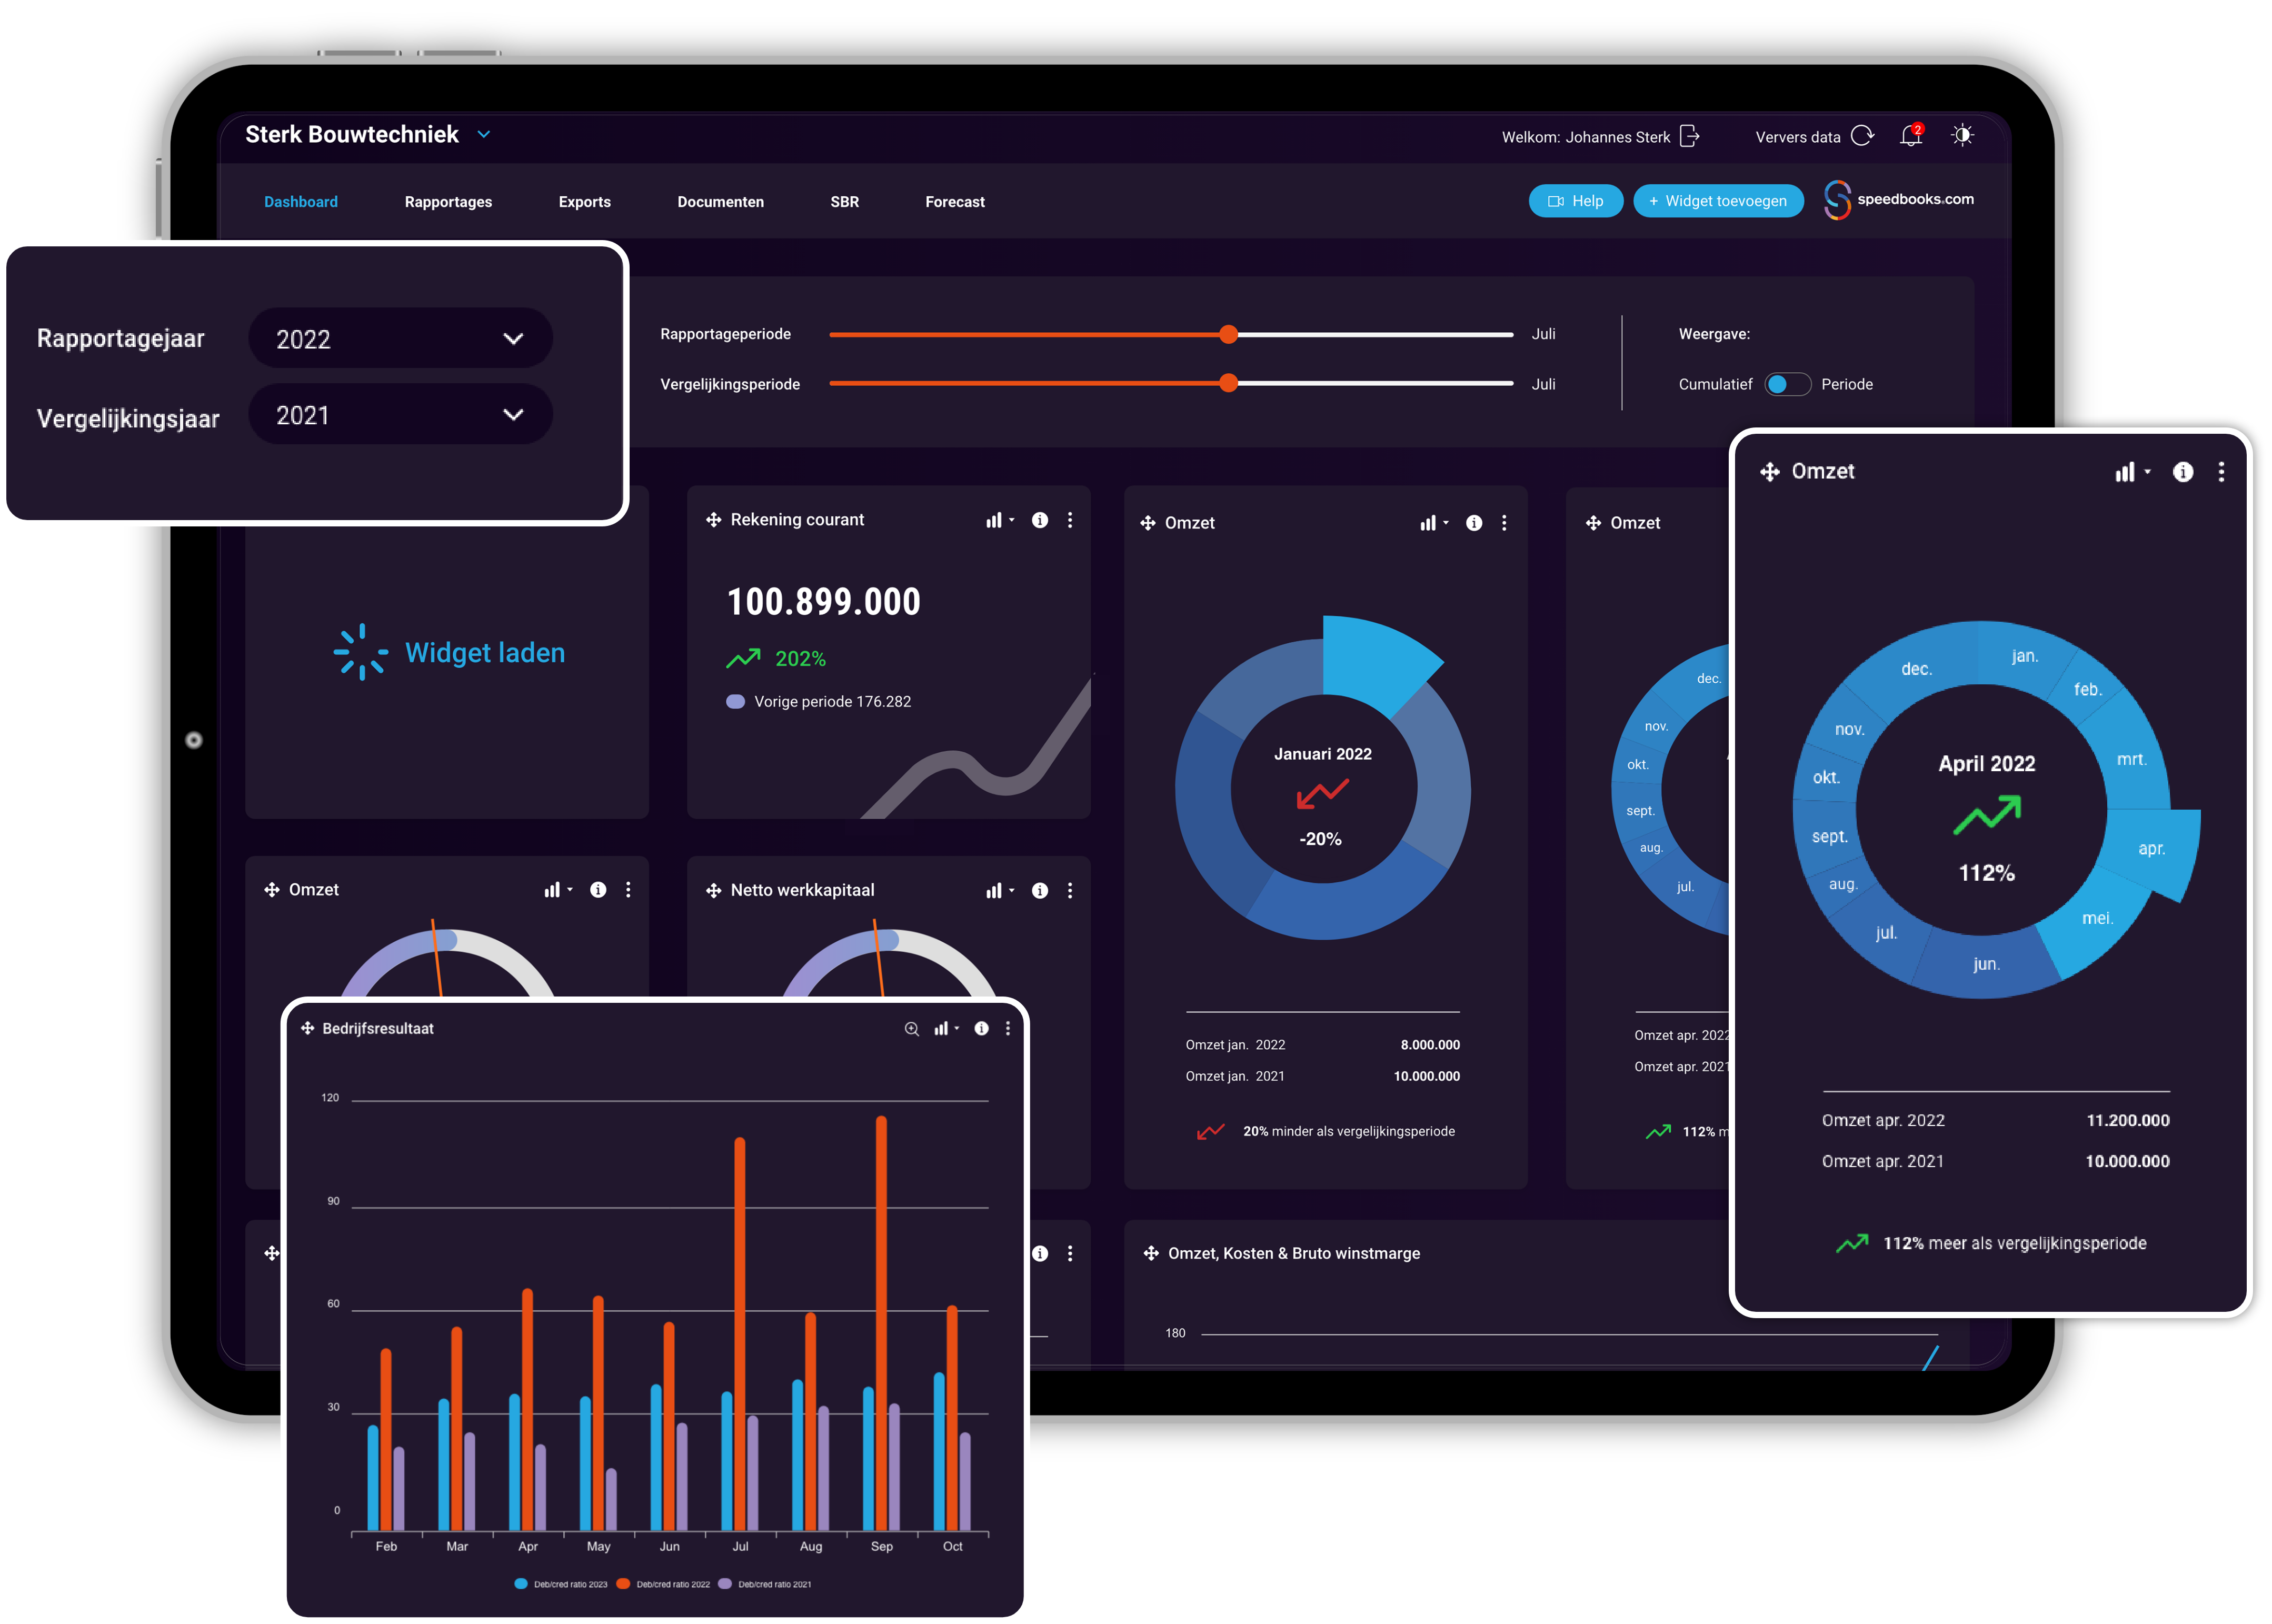
What is a KPI Dashboard
Having financial data continuously available in dashboards for the MT provides better insight into investment opportunities or limitations.
Professional reporting software offers such a dashboard, which you can compile yourself with widgets to always have the desired KPIs at hand.
On the PC, tablet and mobile via an APP, 24/7, anywhere in the world.
It never stops
In practice, you actually draw up the interim financial situation throughout the year in the form of interim figures, a monthly report, a quarterly or Q 1,2,3 or 4 report, a half-yearly report or interim annual accounts (with interim profit and loss account).
And finally, after the end of the financial year, of course, the annual financial report or annual accounts (audited by an accountant).
Management reports as a communication tool
They help disseminate key figures and essential information to different departments and levels of management.
- Top management: The highest executives within an organization, such as the CEO (Chief Executive Officer), CFO (Chief Financial Officer), COO (Chief Operating Officer).
- Board of directors: The board of directors or supervisors who oversee the day-to-day operations.
- Middle management: Managers responsible for specific departments and/or projects within the organization.
- Internal stakeholders: Employees within the organization who are involved in strategic planning, execution and monitoring of objectives.
- External stakeholders: For the information of investors, shareholders, regulators or partners.
Always on top of it
Keeping your finger on the pulse through periodic (financial) management reports enables you to adapt strategies to changing circumstances and market conditions.
This keeps the entire management of the organization sharp and alert.
Rapports in no time
Use modern tools and technologies, such as Speedbooks’ professional reporting software, for data analysis and reporting to make the process more efficient.
This ensures that a report meets the expectations of the person(s) for whom the reports are intended and is useful for their decision-making process and possibly prevents a wrong decision.

About the author drs. Konstantijn Mikes
Founder, inventor and shareholder of Speedbooks reporting software Konstantijn Mikes (1966) is a graduate economist. He studied Economics at the leading Erasmus University in Rotterdam.
At Speedbooks he is responsible for the content development of the reporting software, and he manages the internal developers and the external developers.